Why we are measuring our digital carbon emissions
All online activity generates carbon emissions. Every image downloaded, every click, server call and visit to our site. These types of interactions generate Scope 3 emissions. Lowering these emissions helps Scottish Enterprise towards achieving our Net Zero targets. And, for our users, the user experience is improved, along with SEO, because pages load faster and they use less data interacting with our sites.

Getting started on our journey
We first looked at the impact of our sites in February 2021 where we ran some calculations using a tool highlighted by Climate Action.
You can read more about this in my earlier post Let’s green the web
Several members of the team also registered for Gerry McGovern’s digital waste webinar, he’s leading the conversation and raising awareness about the impact of digital on the environment.
It was clear to see through learnings and data that we could make some improvements in how we develop and create our websites. Work on our new Design System was the perfect opportunity to start putting our learnings into practice.
Working with Yard
We were introduced to Yard in February 2022. They are a sustainable driven digital company committed to reducing theirs and other businesses carbon impact.
Along with Aline and their Digital Beacon tool which enables capture, analysis and calculation of website data, it was suggested we run an audit of SDI, SE and FBS.
We had a particular focus on SDI as this was the first site to migrate to our new Design System. The plan was to run an audit with the existing site then analyse again once the site had re-launched.
What we did next
Aline conducted an audit of the site using analytics data we provided from March 2021 March 2022. Using their Beacon calculation to measure the impact of first visit and return visit.
The audit outlined results and recommendations ranging from quick wins to more complex changes required.
Results

The results are in grams of carbon released. For reference a gram of carbon for a first page visit is the equivalent of:
- Average emissions per page view: 1.958g
- Annual emissions: 1.155T
This also equivalent to:
- Driving an average car for 2,903 miles
- Consuming 2.7 barrels of oil
- Swapping 44 incandescent bulbs for LED bulbs
Recommendations – quick wins
Better image compression
Compressing images before uploading them can vastly reduce the asset size, meaning they will load quicker when requested.
Action – We have asked the content team to compress images before uploading to Umbraco. This has been included in wider training to raise awareness of the impact of content added to the site.
Ensure all images have size attributes
Height and width attributes helps with placement when rendering the rest of the page.
Action – We have recently updated most of our code to reflect this. There are still some gaps to improve.
Recommendations – complex
Code optimisation
Optimising front end code and removing what isn’t used can save significantly on file size
Action – The Design System is a rewrite of the GDL codebase — by focussing on code performance, reuse and quality, code size was reduced. TypeScript and Webpack optimisation helped with this.
Rather than our old GDL’s – Global Design Language “include everything” approach, our new Design System breaks packages into smaller items of required component(s) code — this extends to brand site specific optimisations.
Also, dropping support for legacy browsers such as Internet Explorer, means less backwards-compatible code is required, reducing code size further.
In addition to recommendations
When reviewing some data we noticed that there was a significant decrease in calls to the server. Our old processor for responsive images generated redirects to cached versions, and the new processor returns cached versions directly so there’s only one call per image, significantly reducing the number.

Responsive images with appropriate dimensions
Different devices are served appropriately sized images for their screen-size, reducing the size of image requests
Action – We have recently updated most of our code to reflect this. There are still some gaps to improve.
Content audit and reduction in content
Looking at where we can reduce content, out of date, duplicated and look at where we can streamline journeys.
Action – The content team conducted a full content review of the SDI site, this helped to reduce some content, optimise journeys which also benefits the user experience.
We migrated SDI to our new Design System in Jan 2023 and to help us analyse our data we created this dashboard For a real time view of SDI we have created this dashboard

View our SE web estate carbon dashboard and read more about this in a previous blog article Measuring our carbon output.
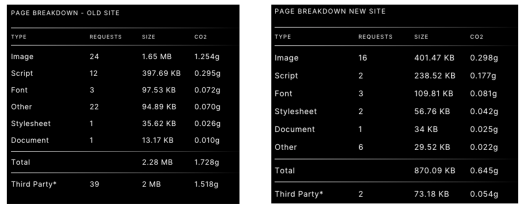
Comparison between our old and new site
Average emissions per page view on the old SDI site at the time of the audit taking place : 1.958g. Average emissions per page view on the new SDI site : 0.678g
Overall this is a reduction of 56.95%

Comparison with a selection of our competitors
We did some comparison with some of our competitor sites , SDI carbon footprint is considerably less than other competitor sites.

Further findings from 2021 – 2023

What’s next
We will continue to review the data we have available, improve where we can and add any learnings to our future migrations.
Louise is a UX Designer with Scottish Enterprise
